Network map, Smart Build and graphs
Visual state: what the engagement looks like right now.
 Availability: both editions. Access: read widely; topology
apply requires
topology.apply.
Network map
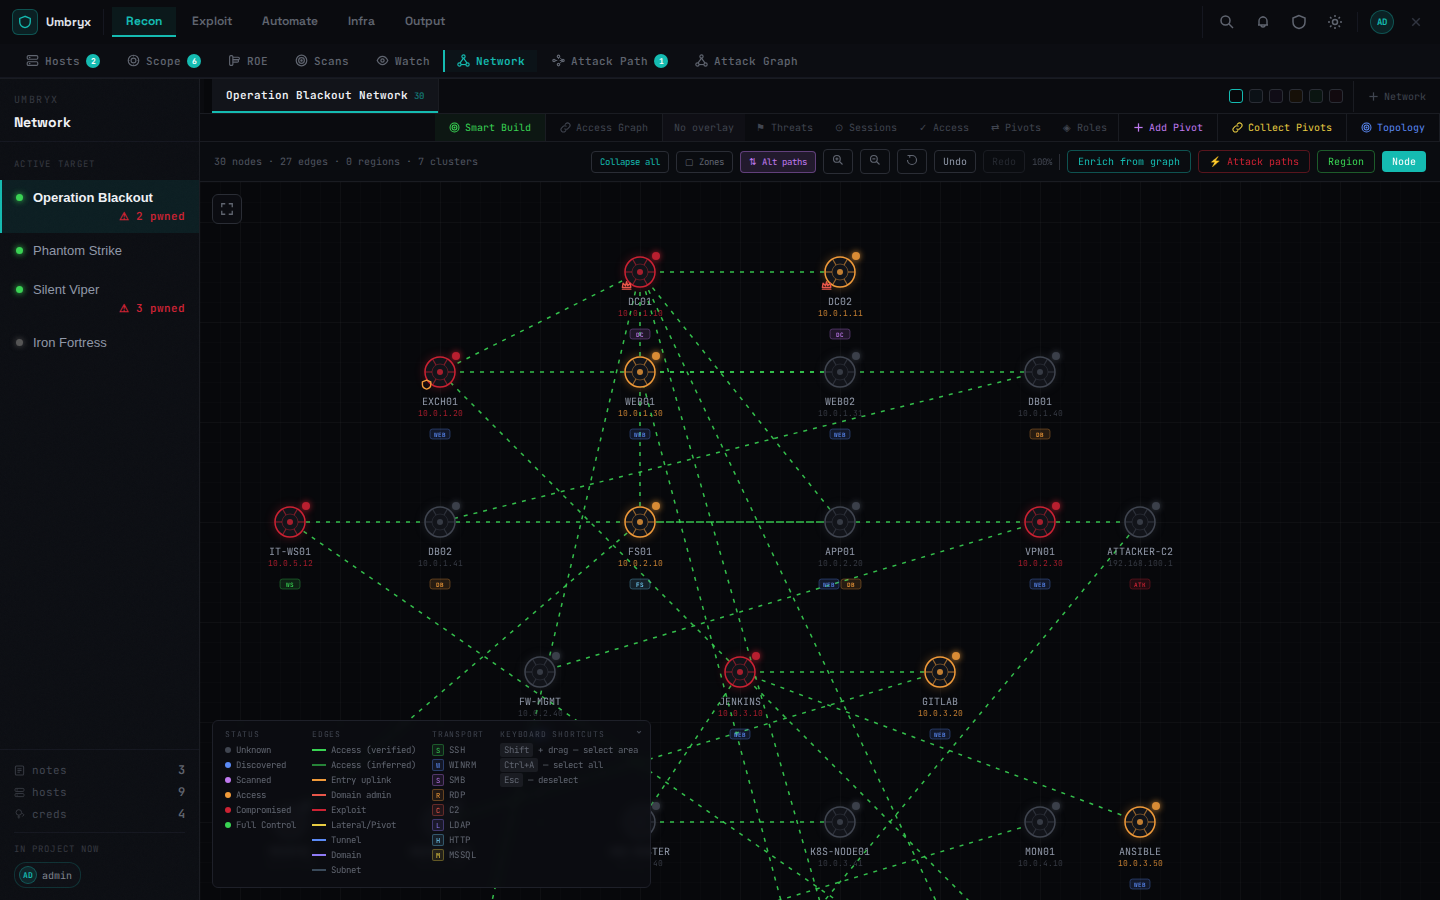
Multiple named maps per project. Canvas with pan/zoom/drag (positions persisted). Toolbar:
- Smart Build — infers nodes, edges and regions from hosts, access edges, domain and subnet relations; decays stale edges
- Access Graph overlay — credential-driven access edges
- Overlays: Threats / Sessions / Access / Pivots / Roles
- Add Pivot — record a tunnel (tool: chisel/ligolo/metasploit/ ssh; type: socks5/route/portfwd/reverse; route CIDR, bind address)
- Collect Pivots — re-collect tunnel state
- Topology — build a map from scan sources (module; off = 503)
Live pivot changes arrive over WebSocket.
Attack graph
The canonical auto-generated graph (GET /attack-graph): hosts,
cred nodes, access edges and pivot edges. Features:
- Credentials as first-class nodes; columns are depth from the attacker ("how deep are we")
- How we got here / what it opens on node click — the compromise chain instead of edge-tracing by eye
- Privilege mode + Paths panel: privilege paths to DA-capable hosts and pivot chains; selecting a path fits it into view
- Frontier: dims confirmed facts, rings unvalidated creds and inferred access, lists what to validate next
- Edge freshness: access facts older than 14 days fade
- Live updates over WebSocket; PNG snapshot export
See Map vs Attack Graph vs Attack Path for how the three surfaces differ.
Attack paths (manual)
Deliberate trees of steps (action / condition / milestone /
pivot) with statuses (hypothetical → planned → executing → verified /
failed), confidence, MITRE techniques auto-suggested from KB articles
(tagged Txxxx), branches and versions (snapshot/revert).
Attack path vs attack graph
Paths are what you plan; the graph is what the data says. Both feed the report (paths with steps; graph intel).
Expected behavior
- Scan/cred-validation output updates the graph without manual edits
- Smart Build reports what it added (
+N edges · +N nodes · +N
  regions, stale decayed
)