Reporting and the timeline
Turning project state into deliverables — and proving how it got there. Availability: both editions.
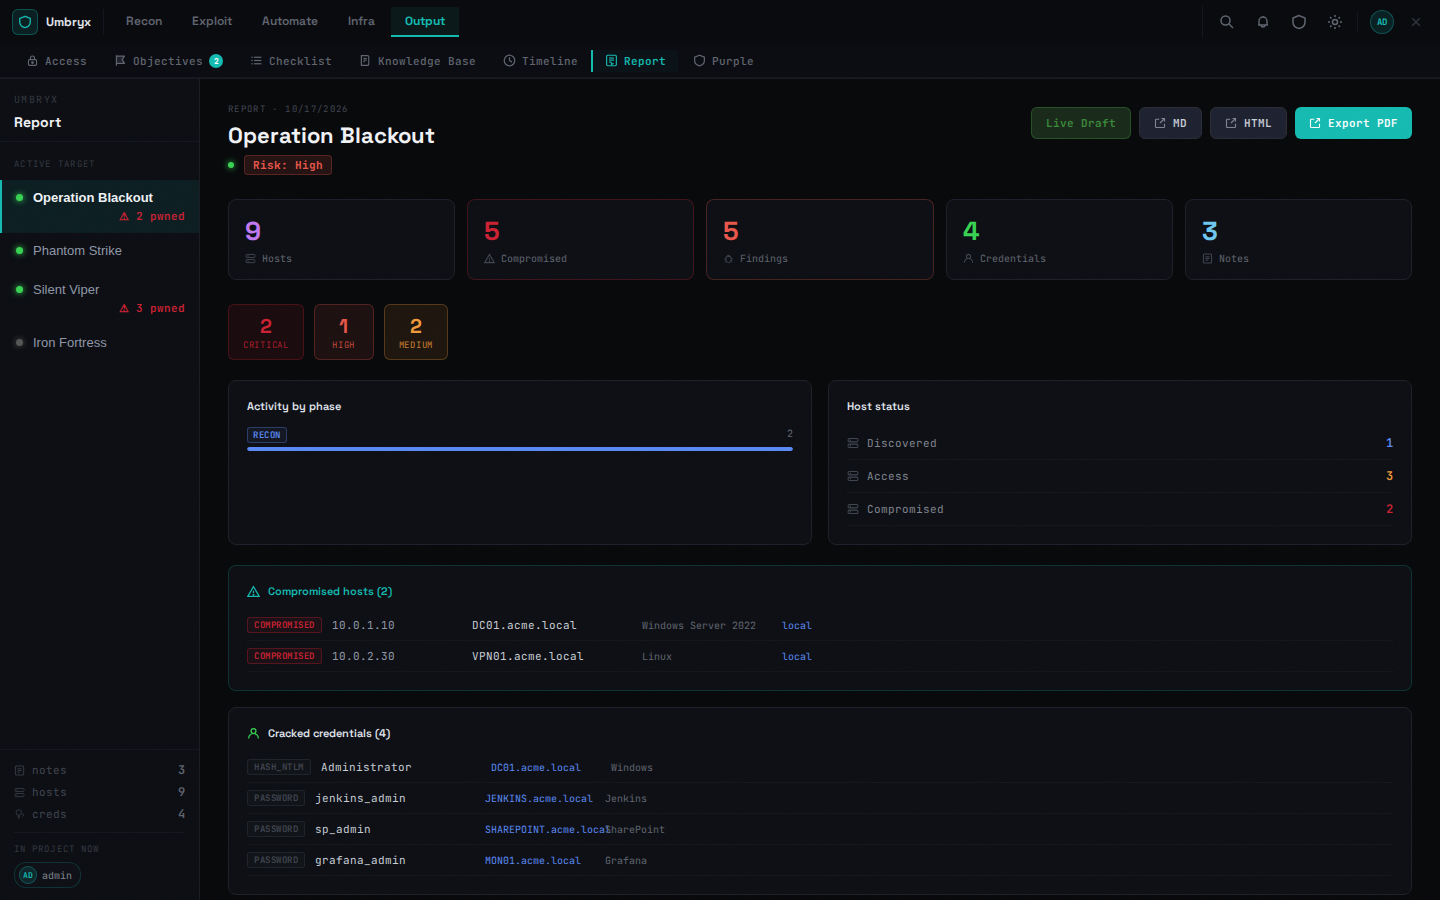
Report
Builds from live data: scope, severity summary, host inventory and status, findings with proof/recommendation, cracked credentials, attack paths with steps, graph intel, activity log.
Export formats (all server-rendered from the same data):
- PDF (WeasyPrint; falls back to HTML when WeasyPrint is absent)
- HTML — standalone styled document
- Markdown — server draft ("Live Draft" preview) and a client-side export with YAML frontmatter and executive summary
C2 commands without agent confirmation are marked ⚠ UNCONFIRMED.
Rate-limited (10/min); requires findings.read.
Purple
Purple-team view: MITRE technique coverage derived from attack-path steps and graph edges tagged by Smart Build, tactic chips, findings by severity, and a defender timeline (what the blue side could see). Copies a Markdown purple report to the clipboard.
Timeline
Chronological project events — entity changes plus audit events (secret reveals, exports, member changes). Grouped by date, paginated in chunks ("show older") to stay responsive on large engagements.
Snapshots: capture selected data groups (notes, findings, hosts, graph) and apply them later to roll back; per-event undo for supported actions.
Decommission report
Produced by the Closure Wizard when closing a project: what infrastructure existed, what was revoked/torn down, and what remains. In EE this includes stack teardown results.
Expected behavior
- Reports never require manual copy-paste from the UI
- Audit events survive entity deletion